Here, we provide our results with descriptions.
-
TCGA Data Statistics
-
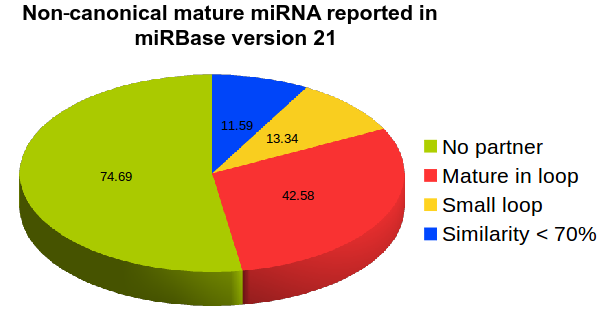
Distribution of known miRNAs in miRBase version 21 which display significant diversion from typical concept of canonical miRNA
-
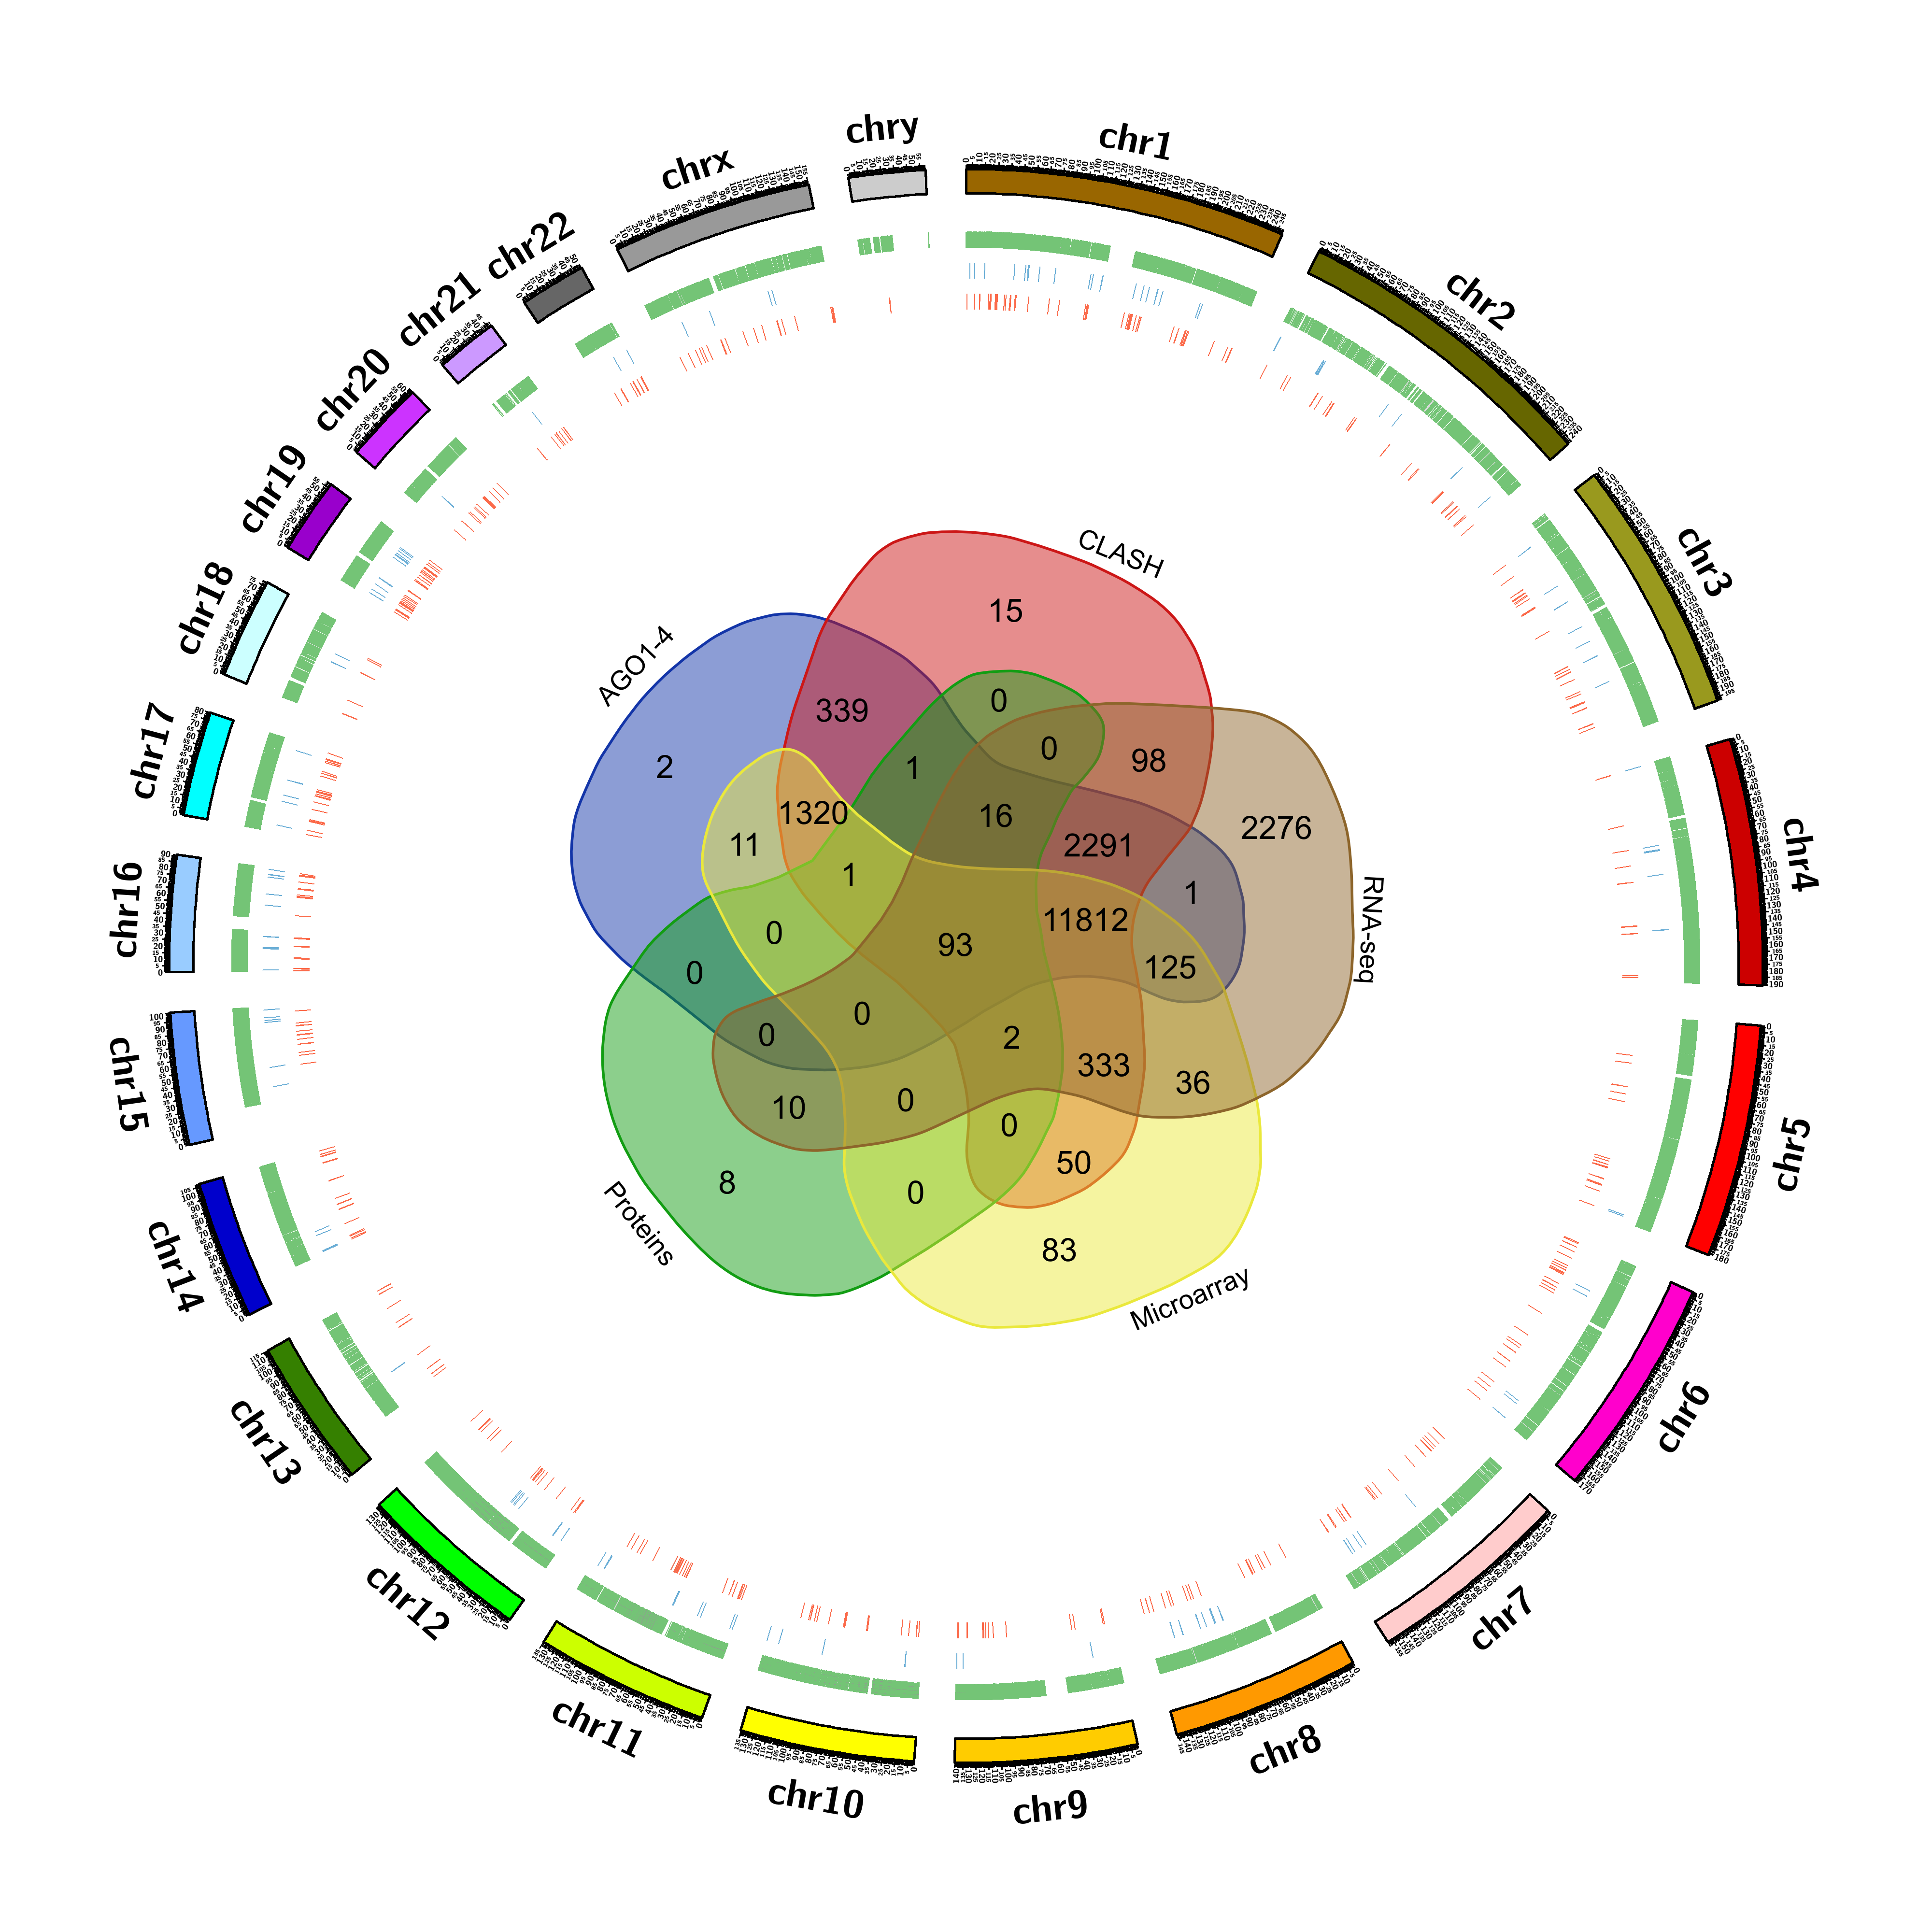
Venn diagram representing target genes identified in AGO1-4 HITS-CLIP data and CLASH seq-data. Most of these rsRNA:target gene site (10,621) was identified in all the five methods
-
Figure illustrate the target genes whose targeting rsRNAs have biogenesis locus on the respective opposite strand and the target binding sites and rsRNA biogenesis site coincides
-
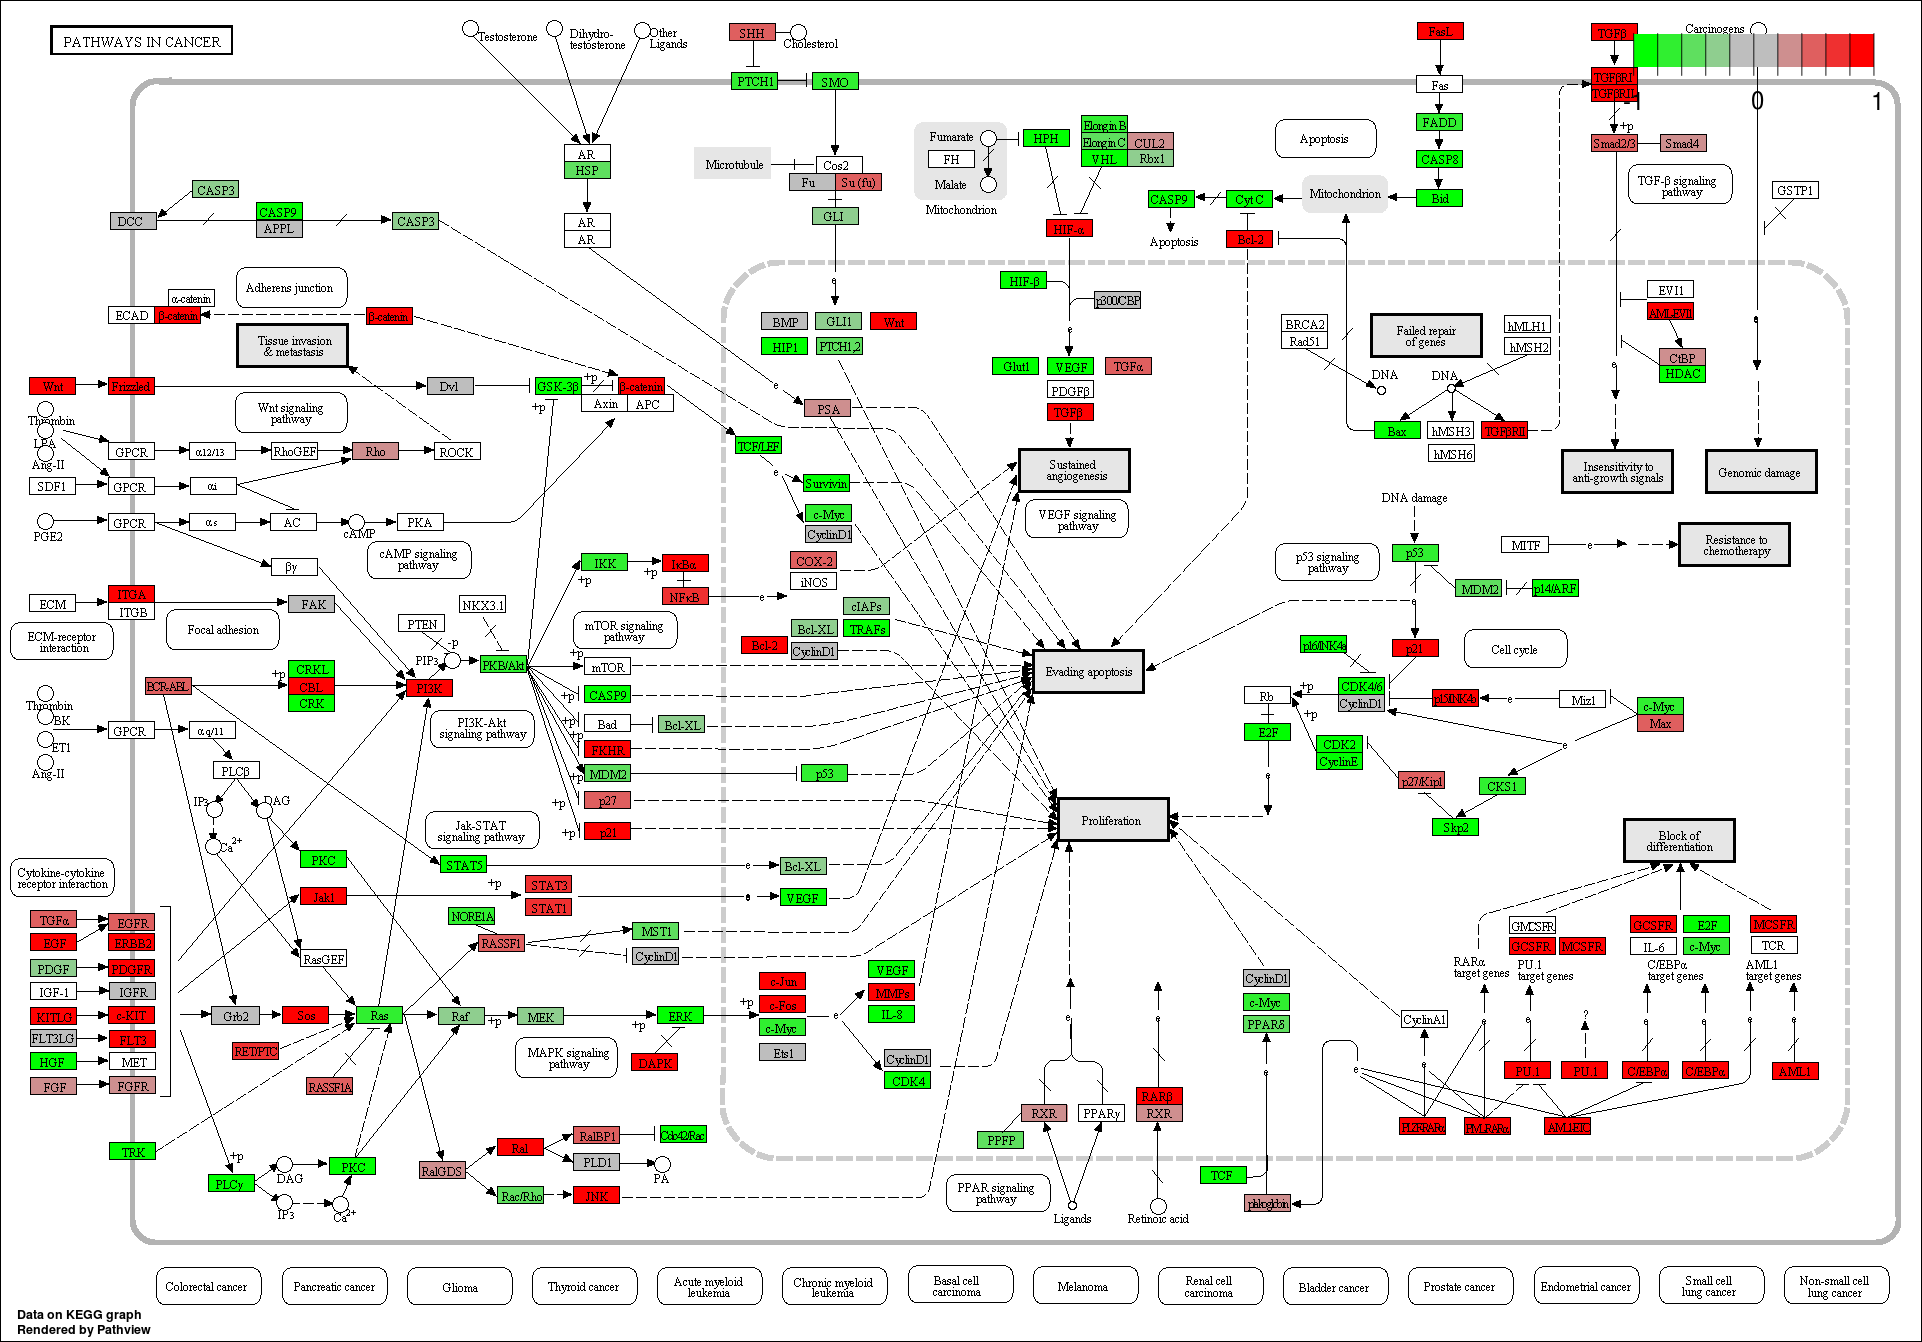
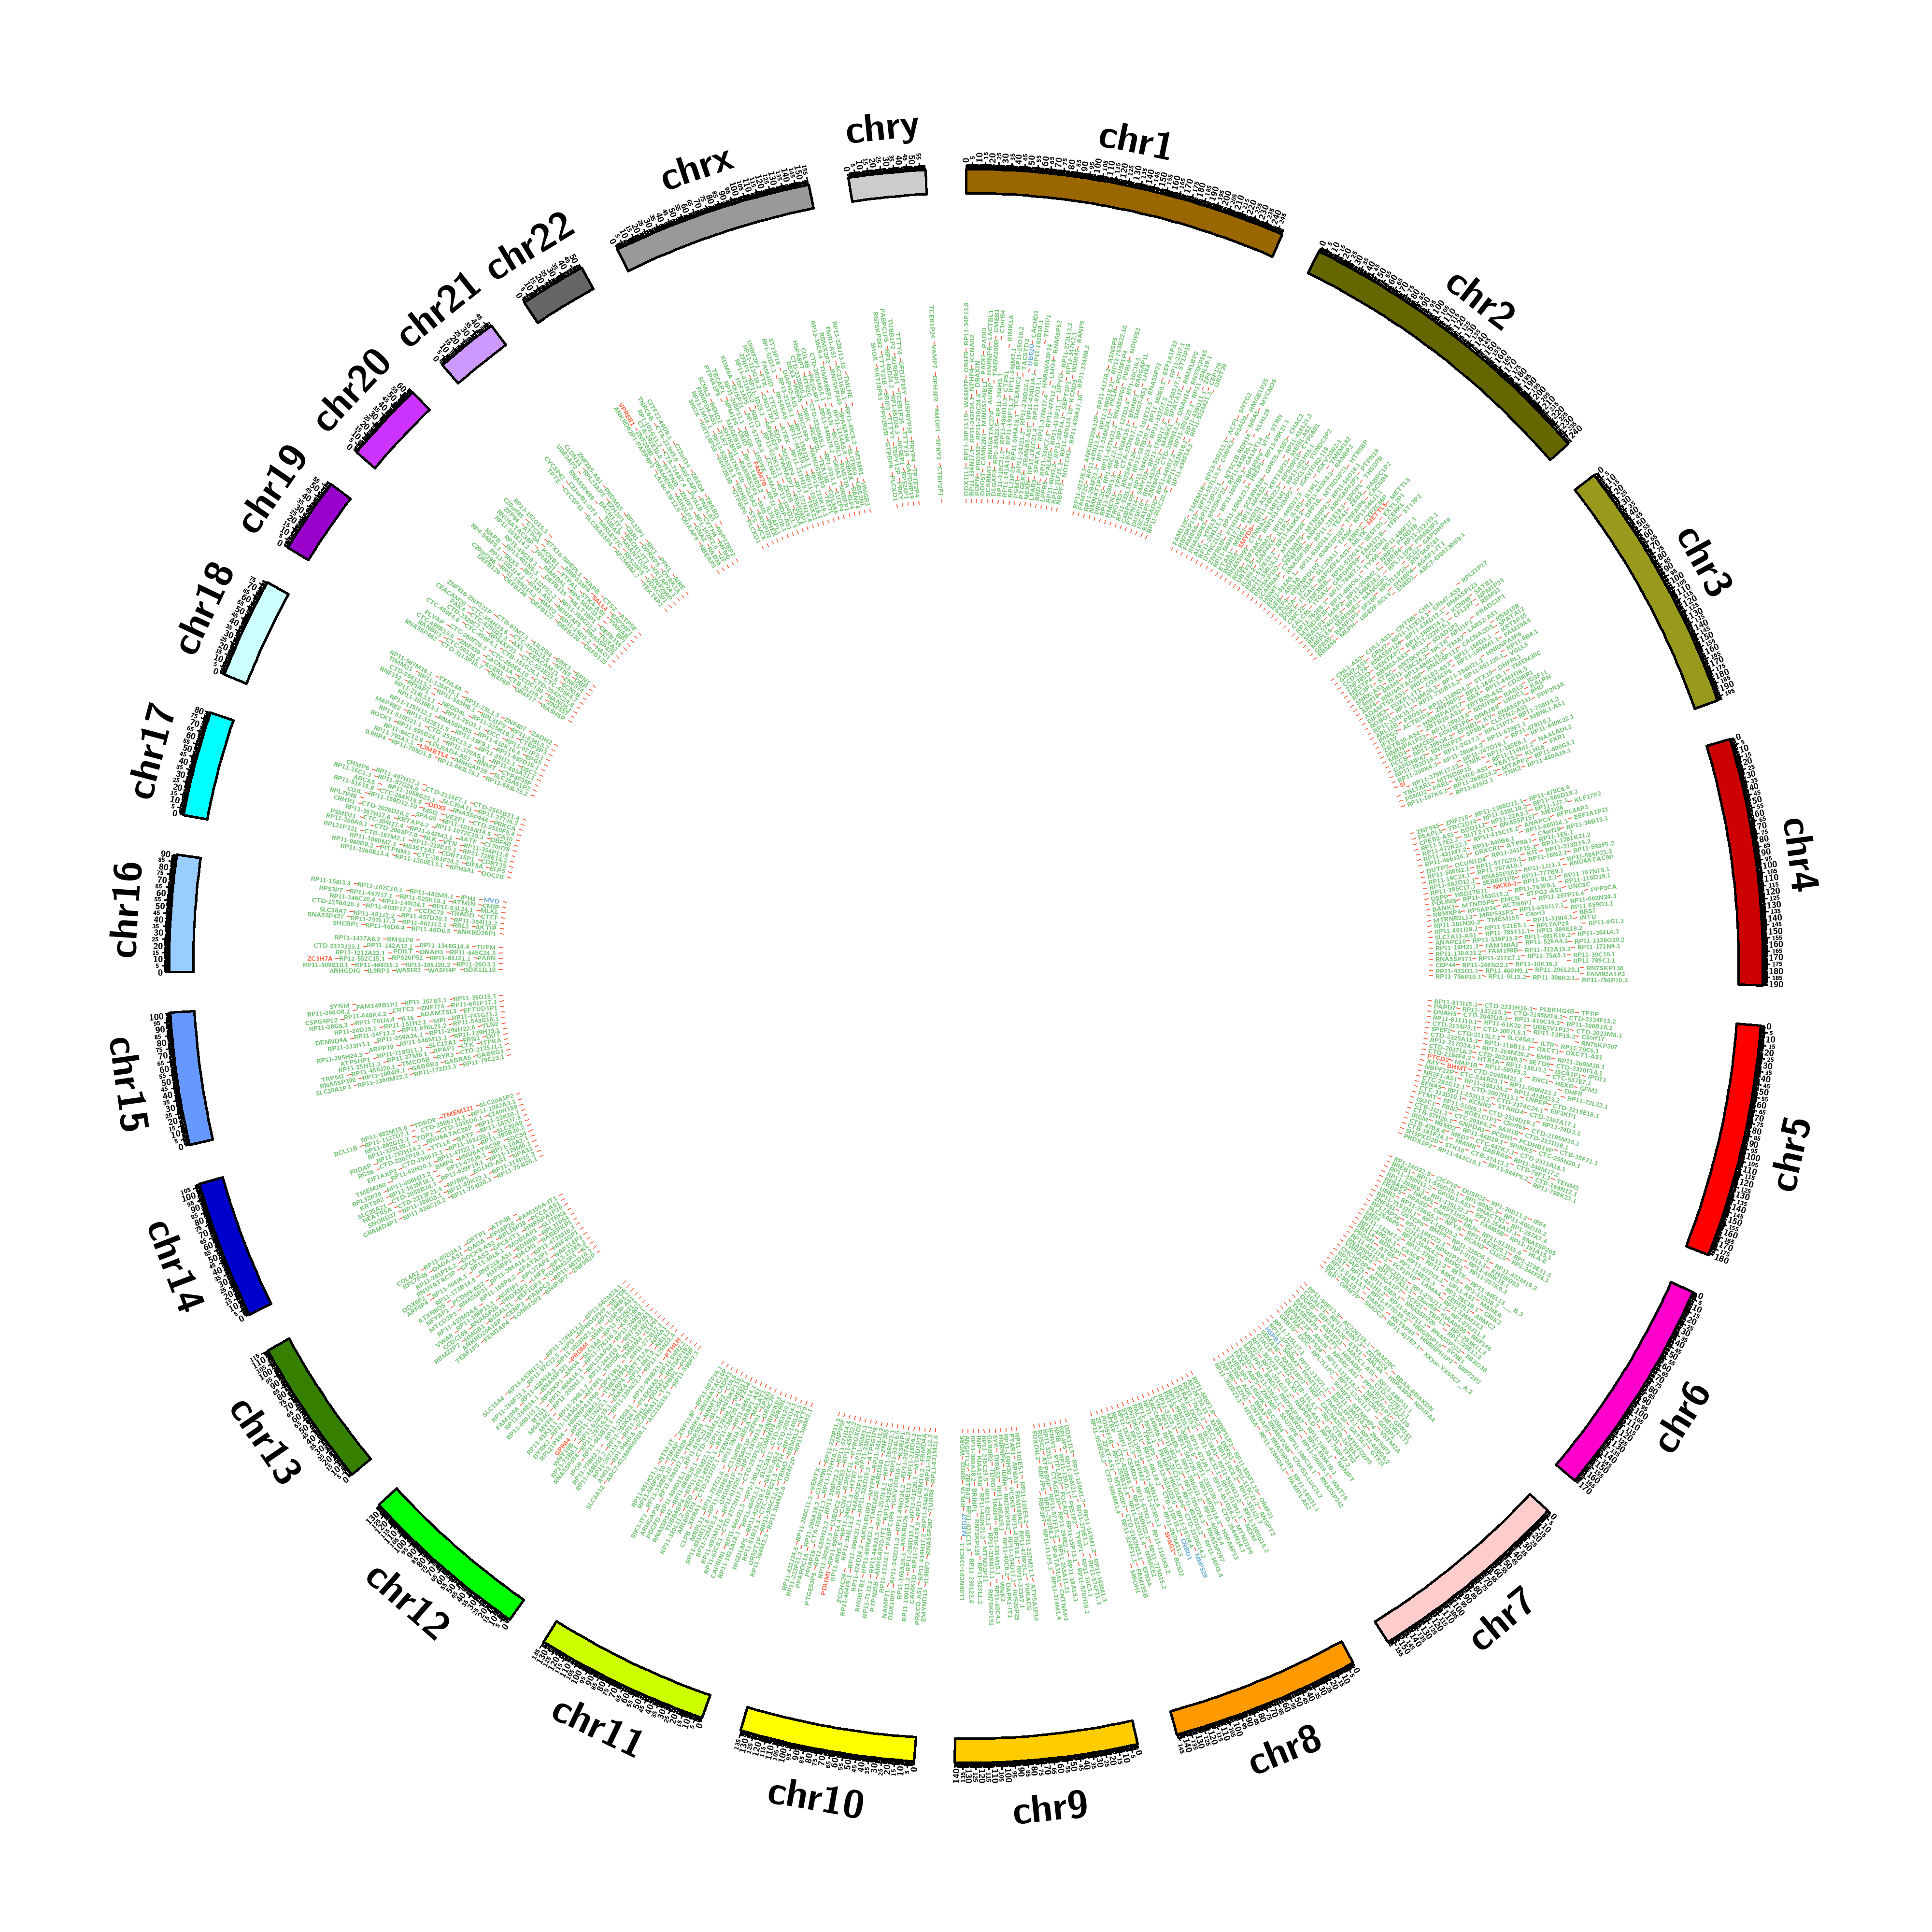
Cancer associated target genes identified in this study. Genes in green shows down-regulation in cancer states, whereas genes in red show up-regulation in cancer in this study
-
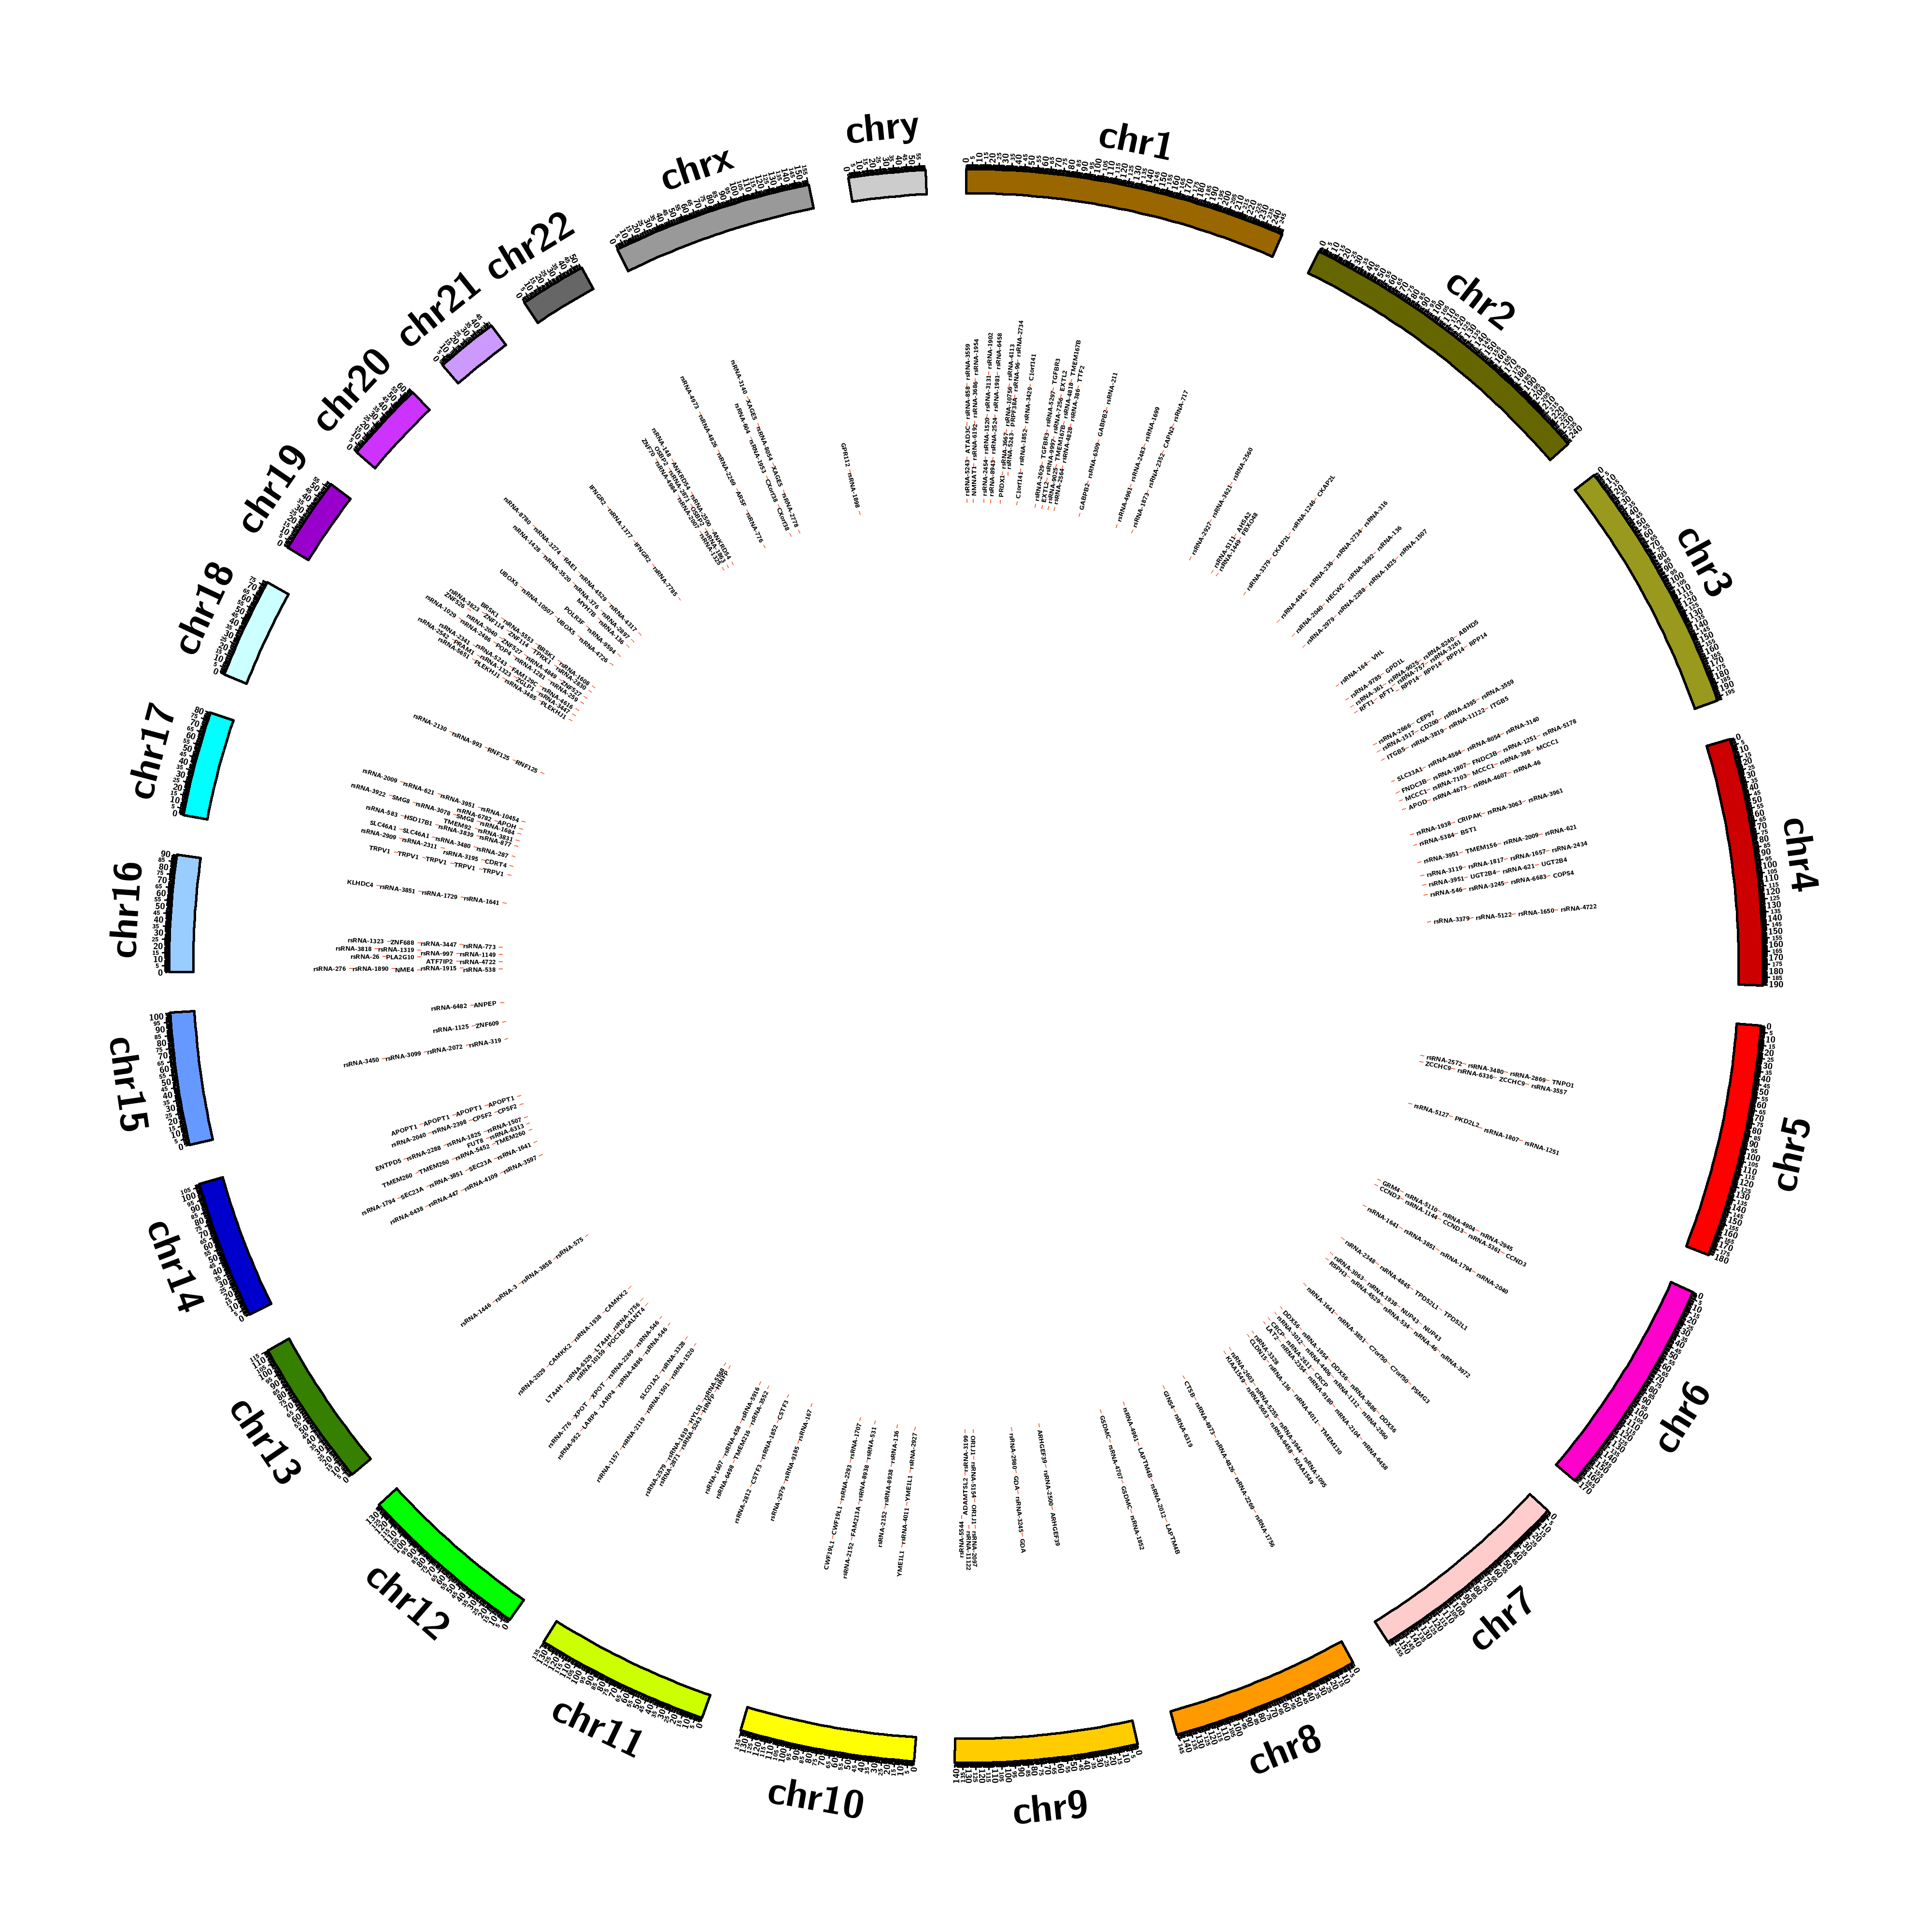
Overall distribution and associations of rsRNAs regions. Large number of rsRNAs were found associated with complex repetitive elements
-
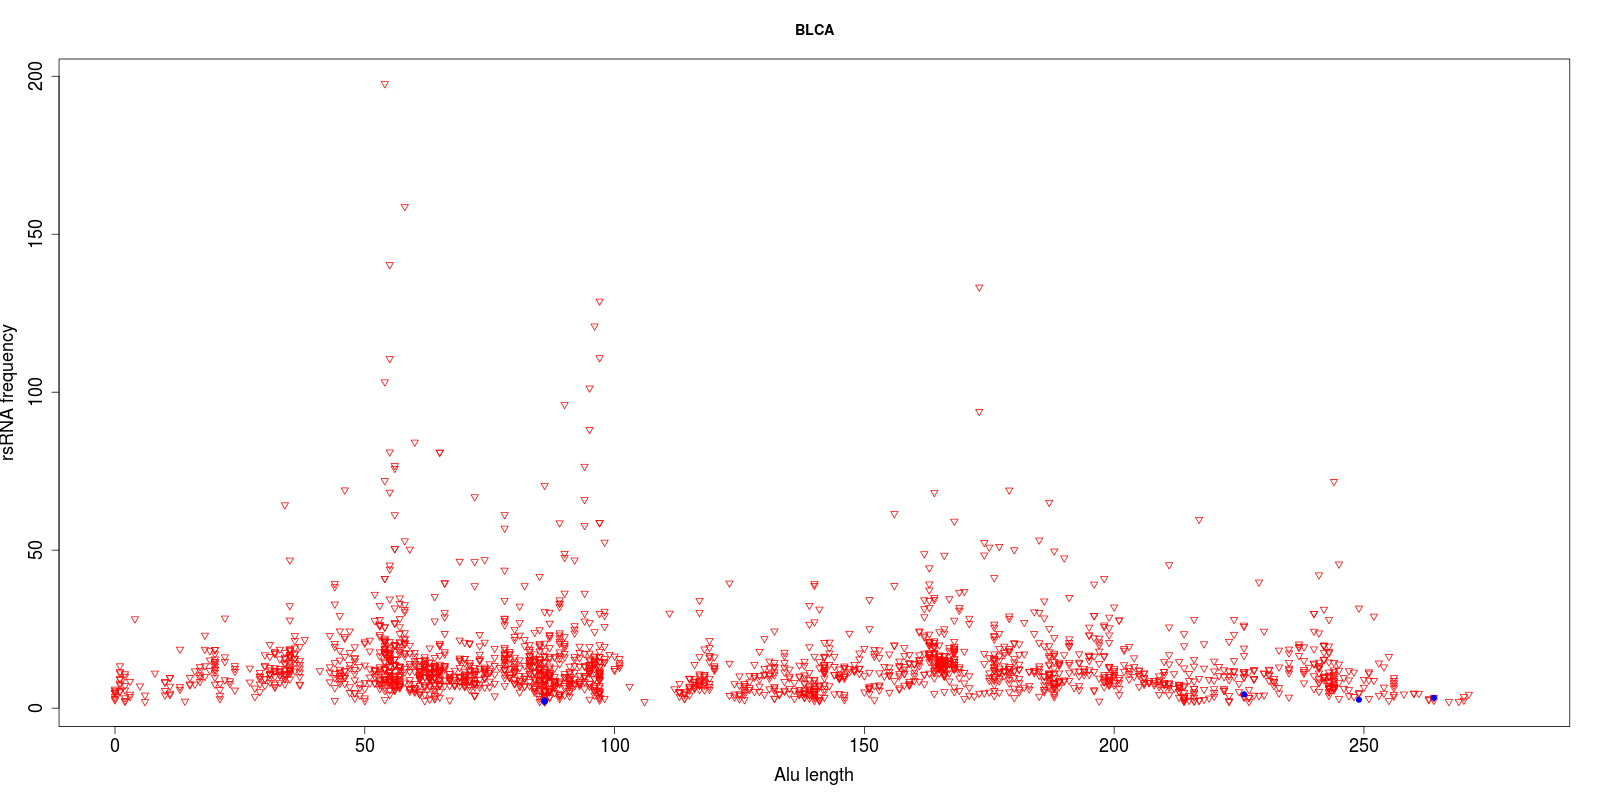
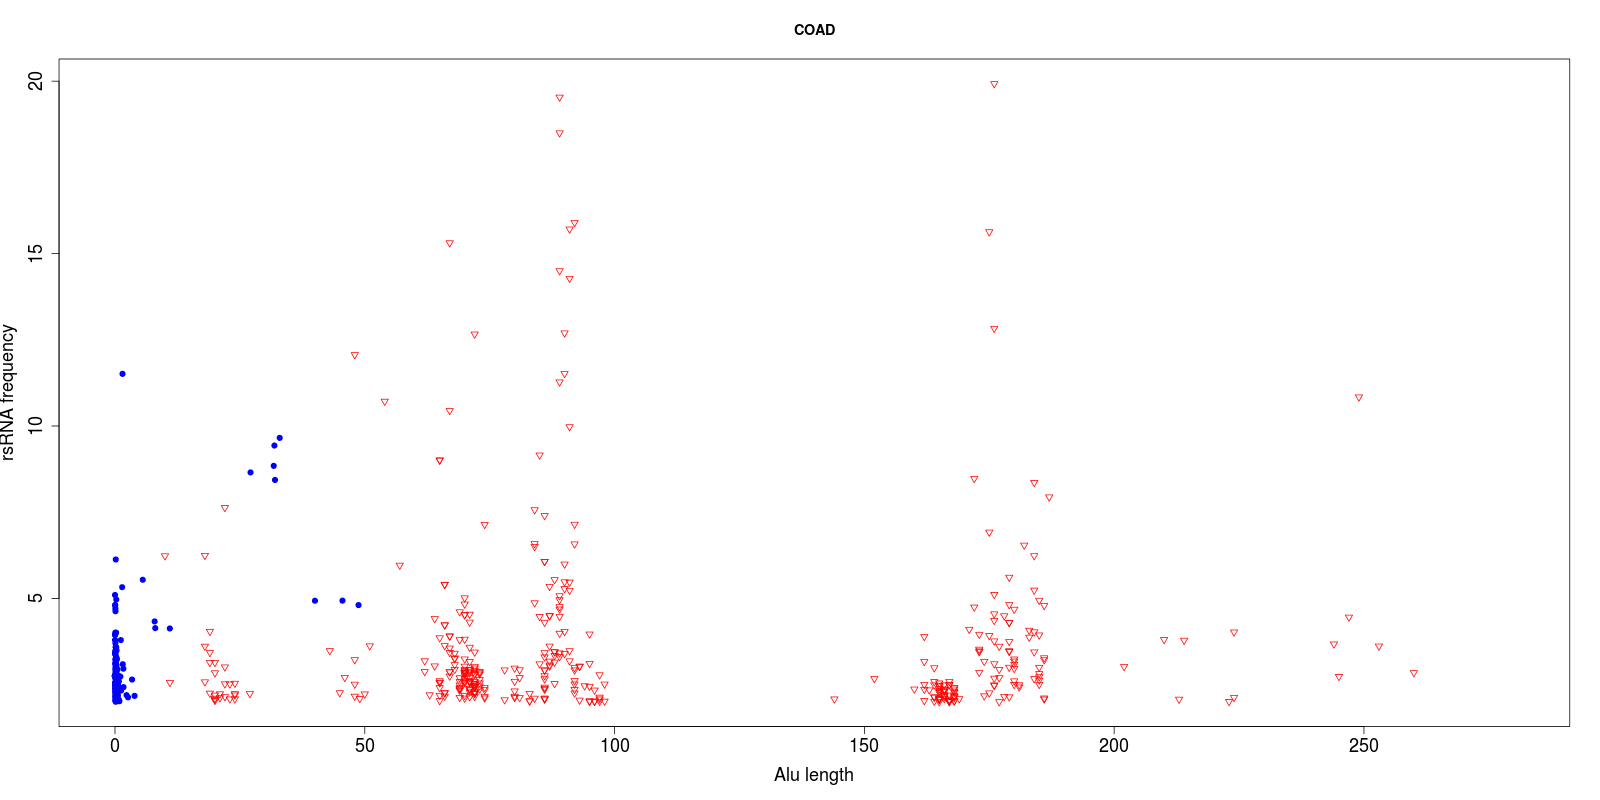
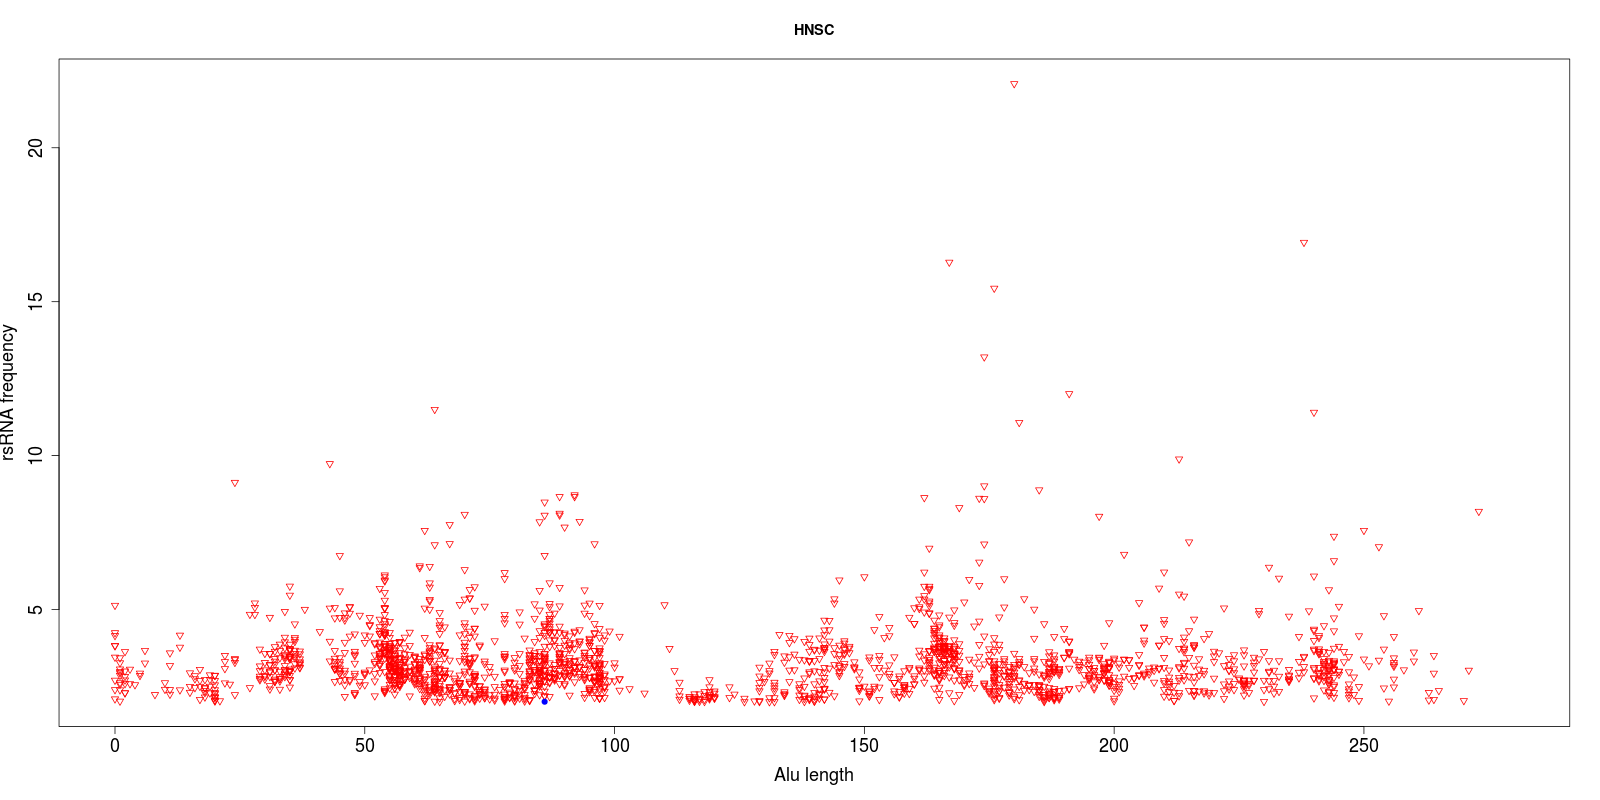
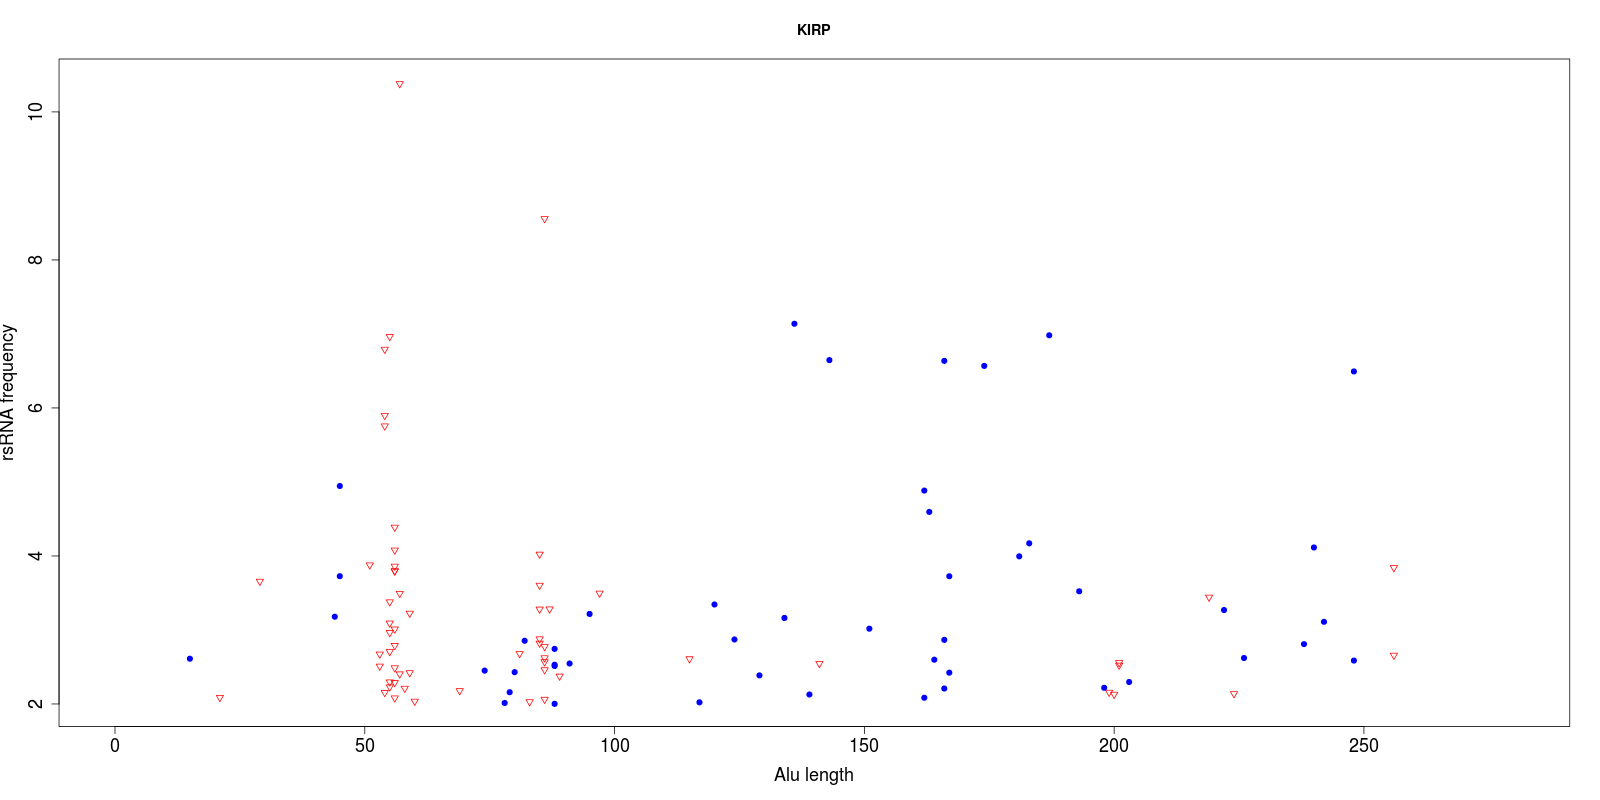
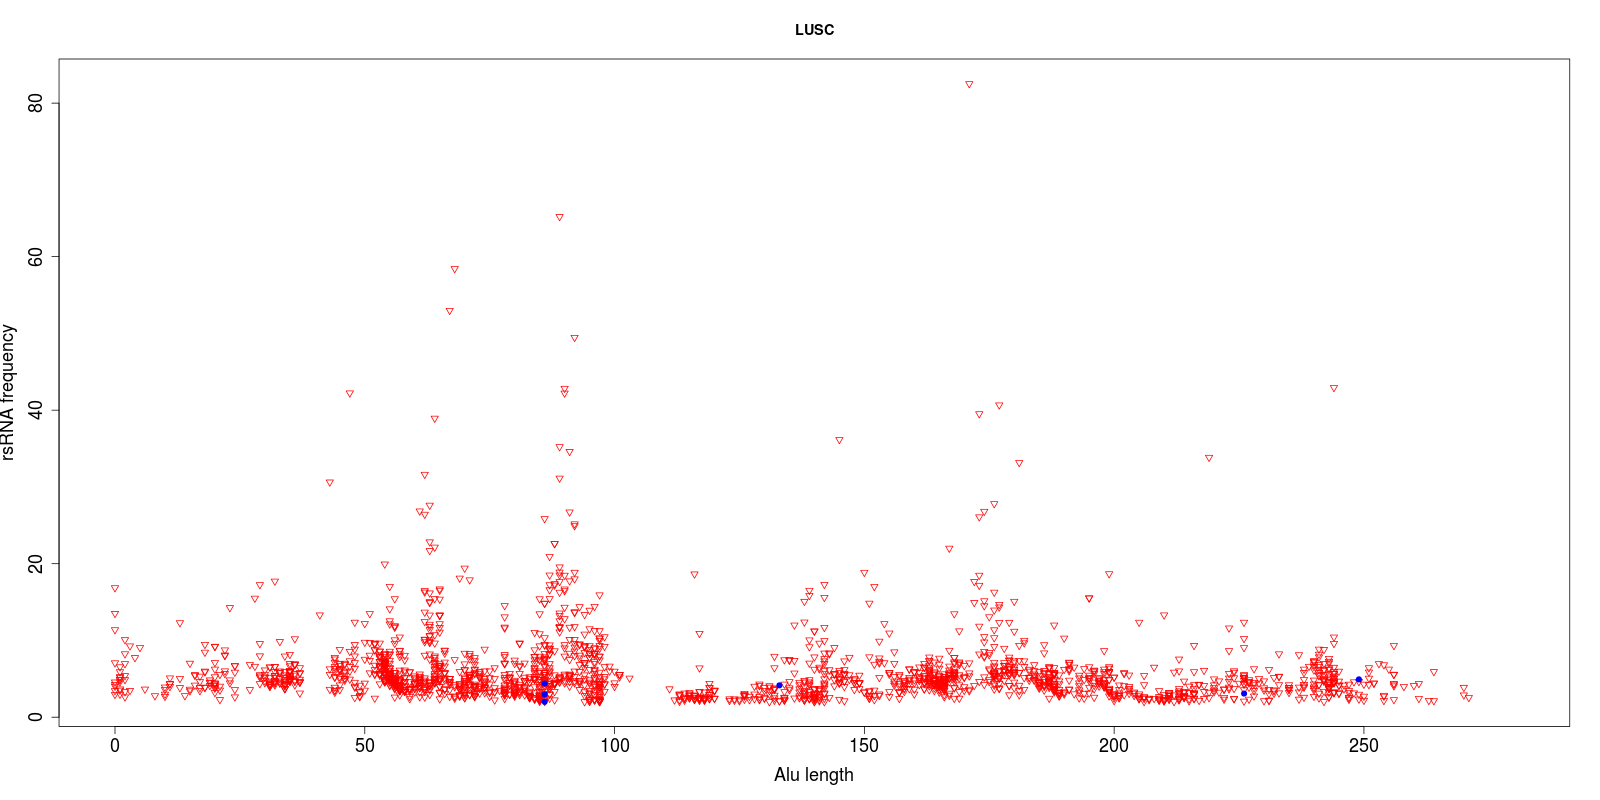
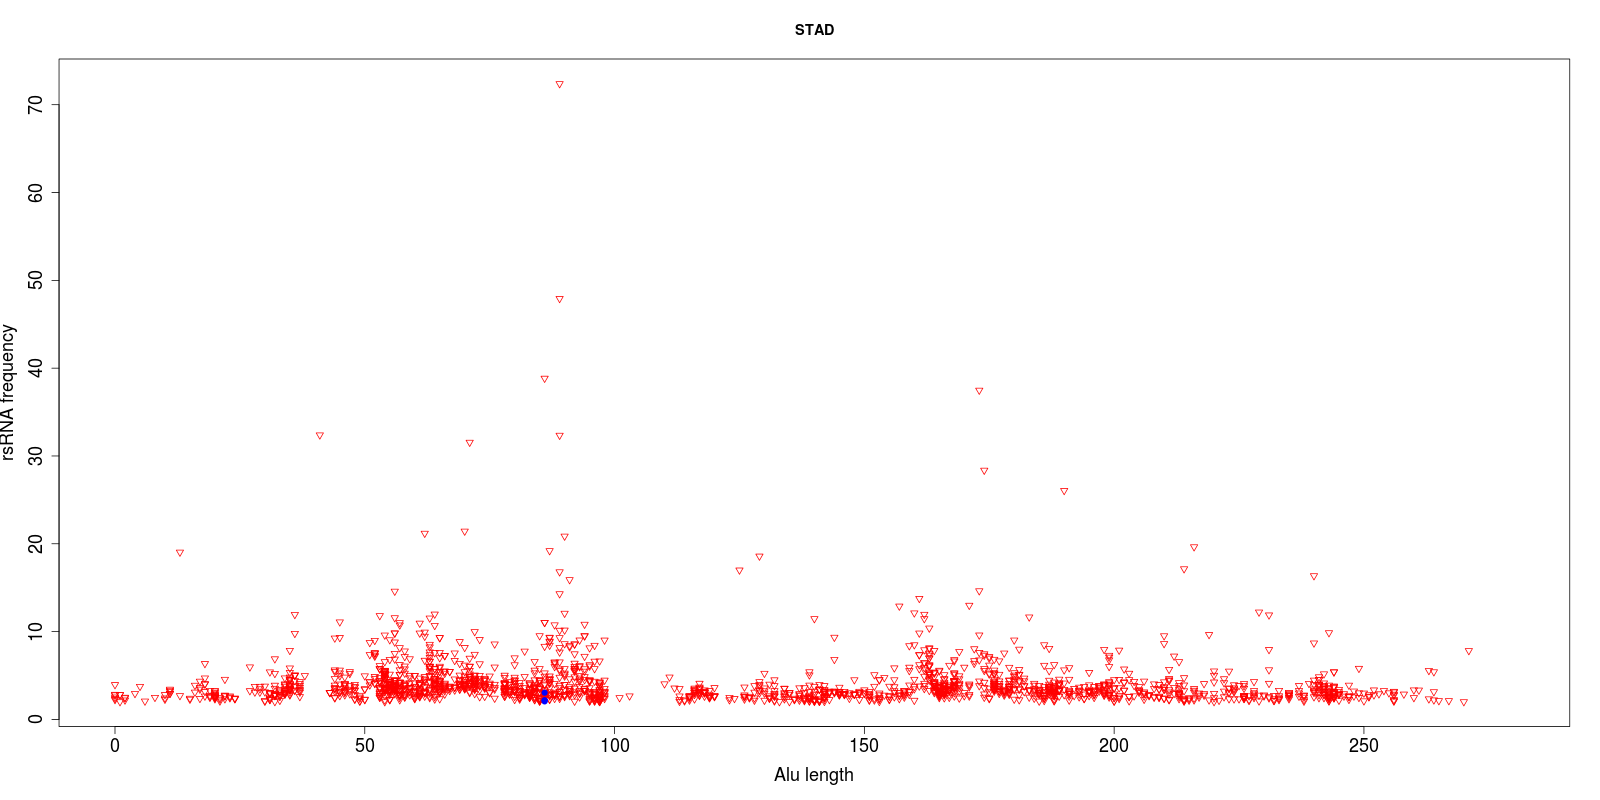
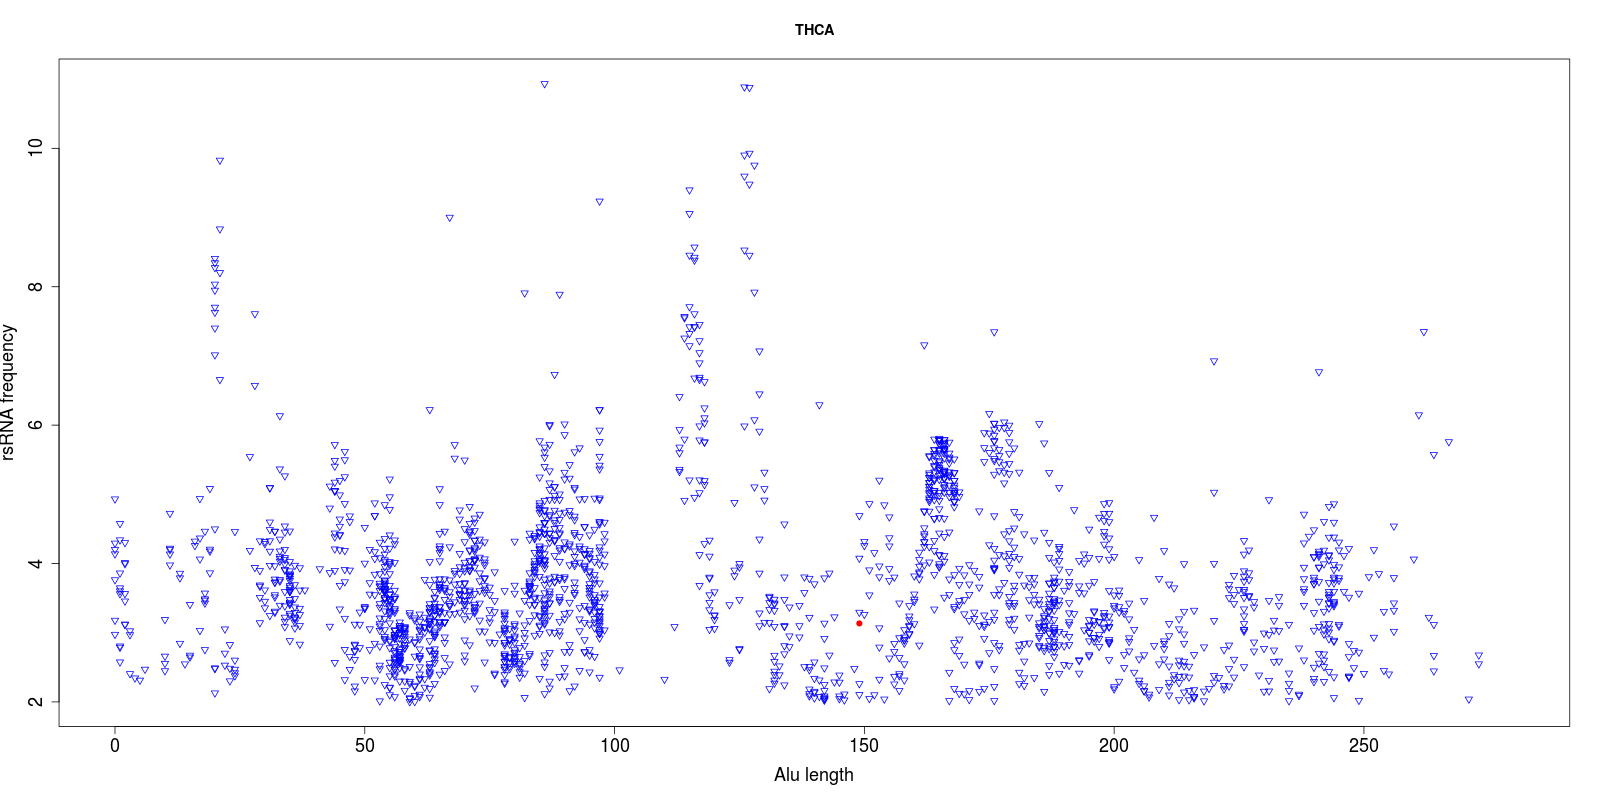
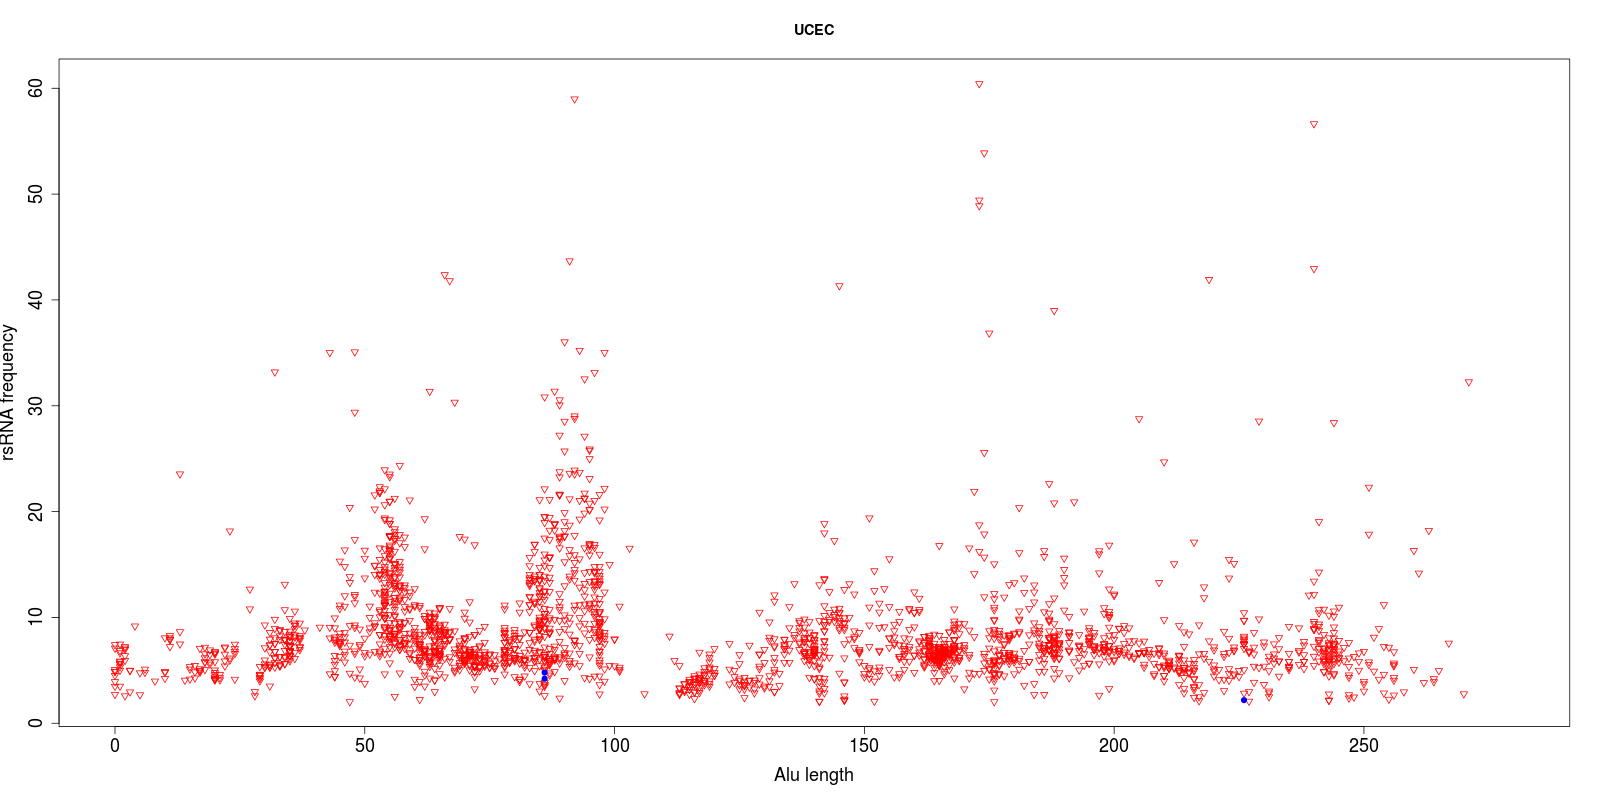
(A)
Comparison of rsRNAs expression profile over the Alu consensus for normal and cancerous conditions across five individuals for BLCA cancer.
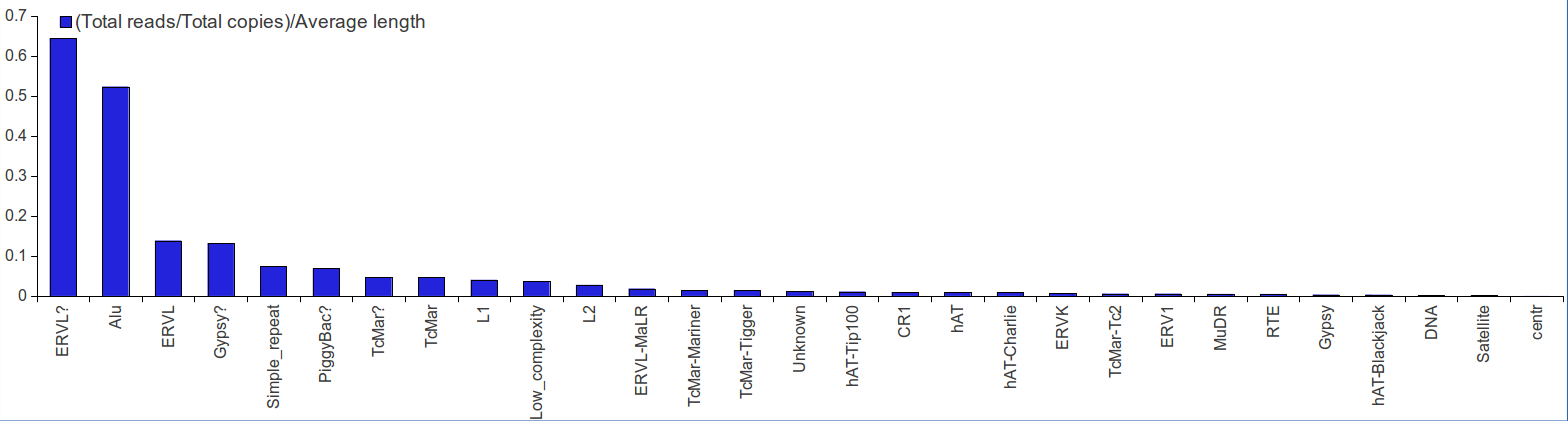
(B)
Distribution of reads mapping on rsRNAs originating from repetitive elements normalized by totao number of repeat copy and average length of repeats
-
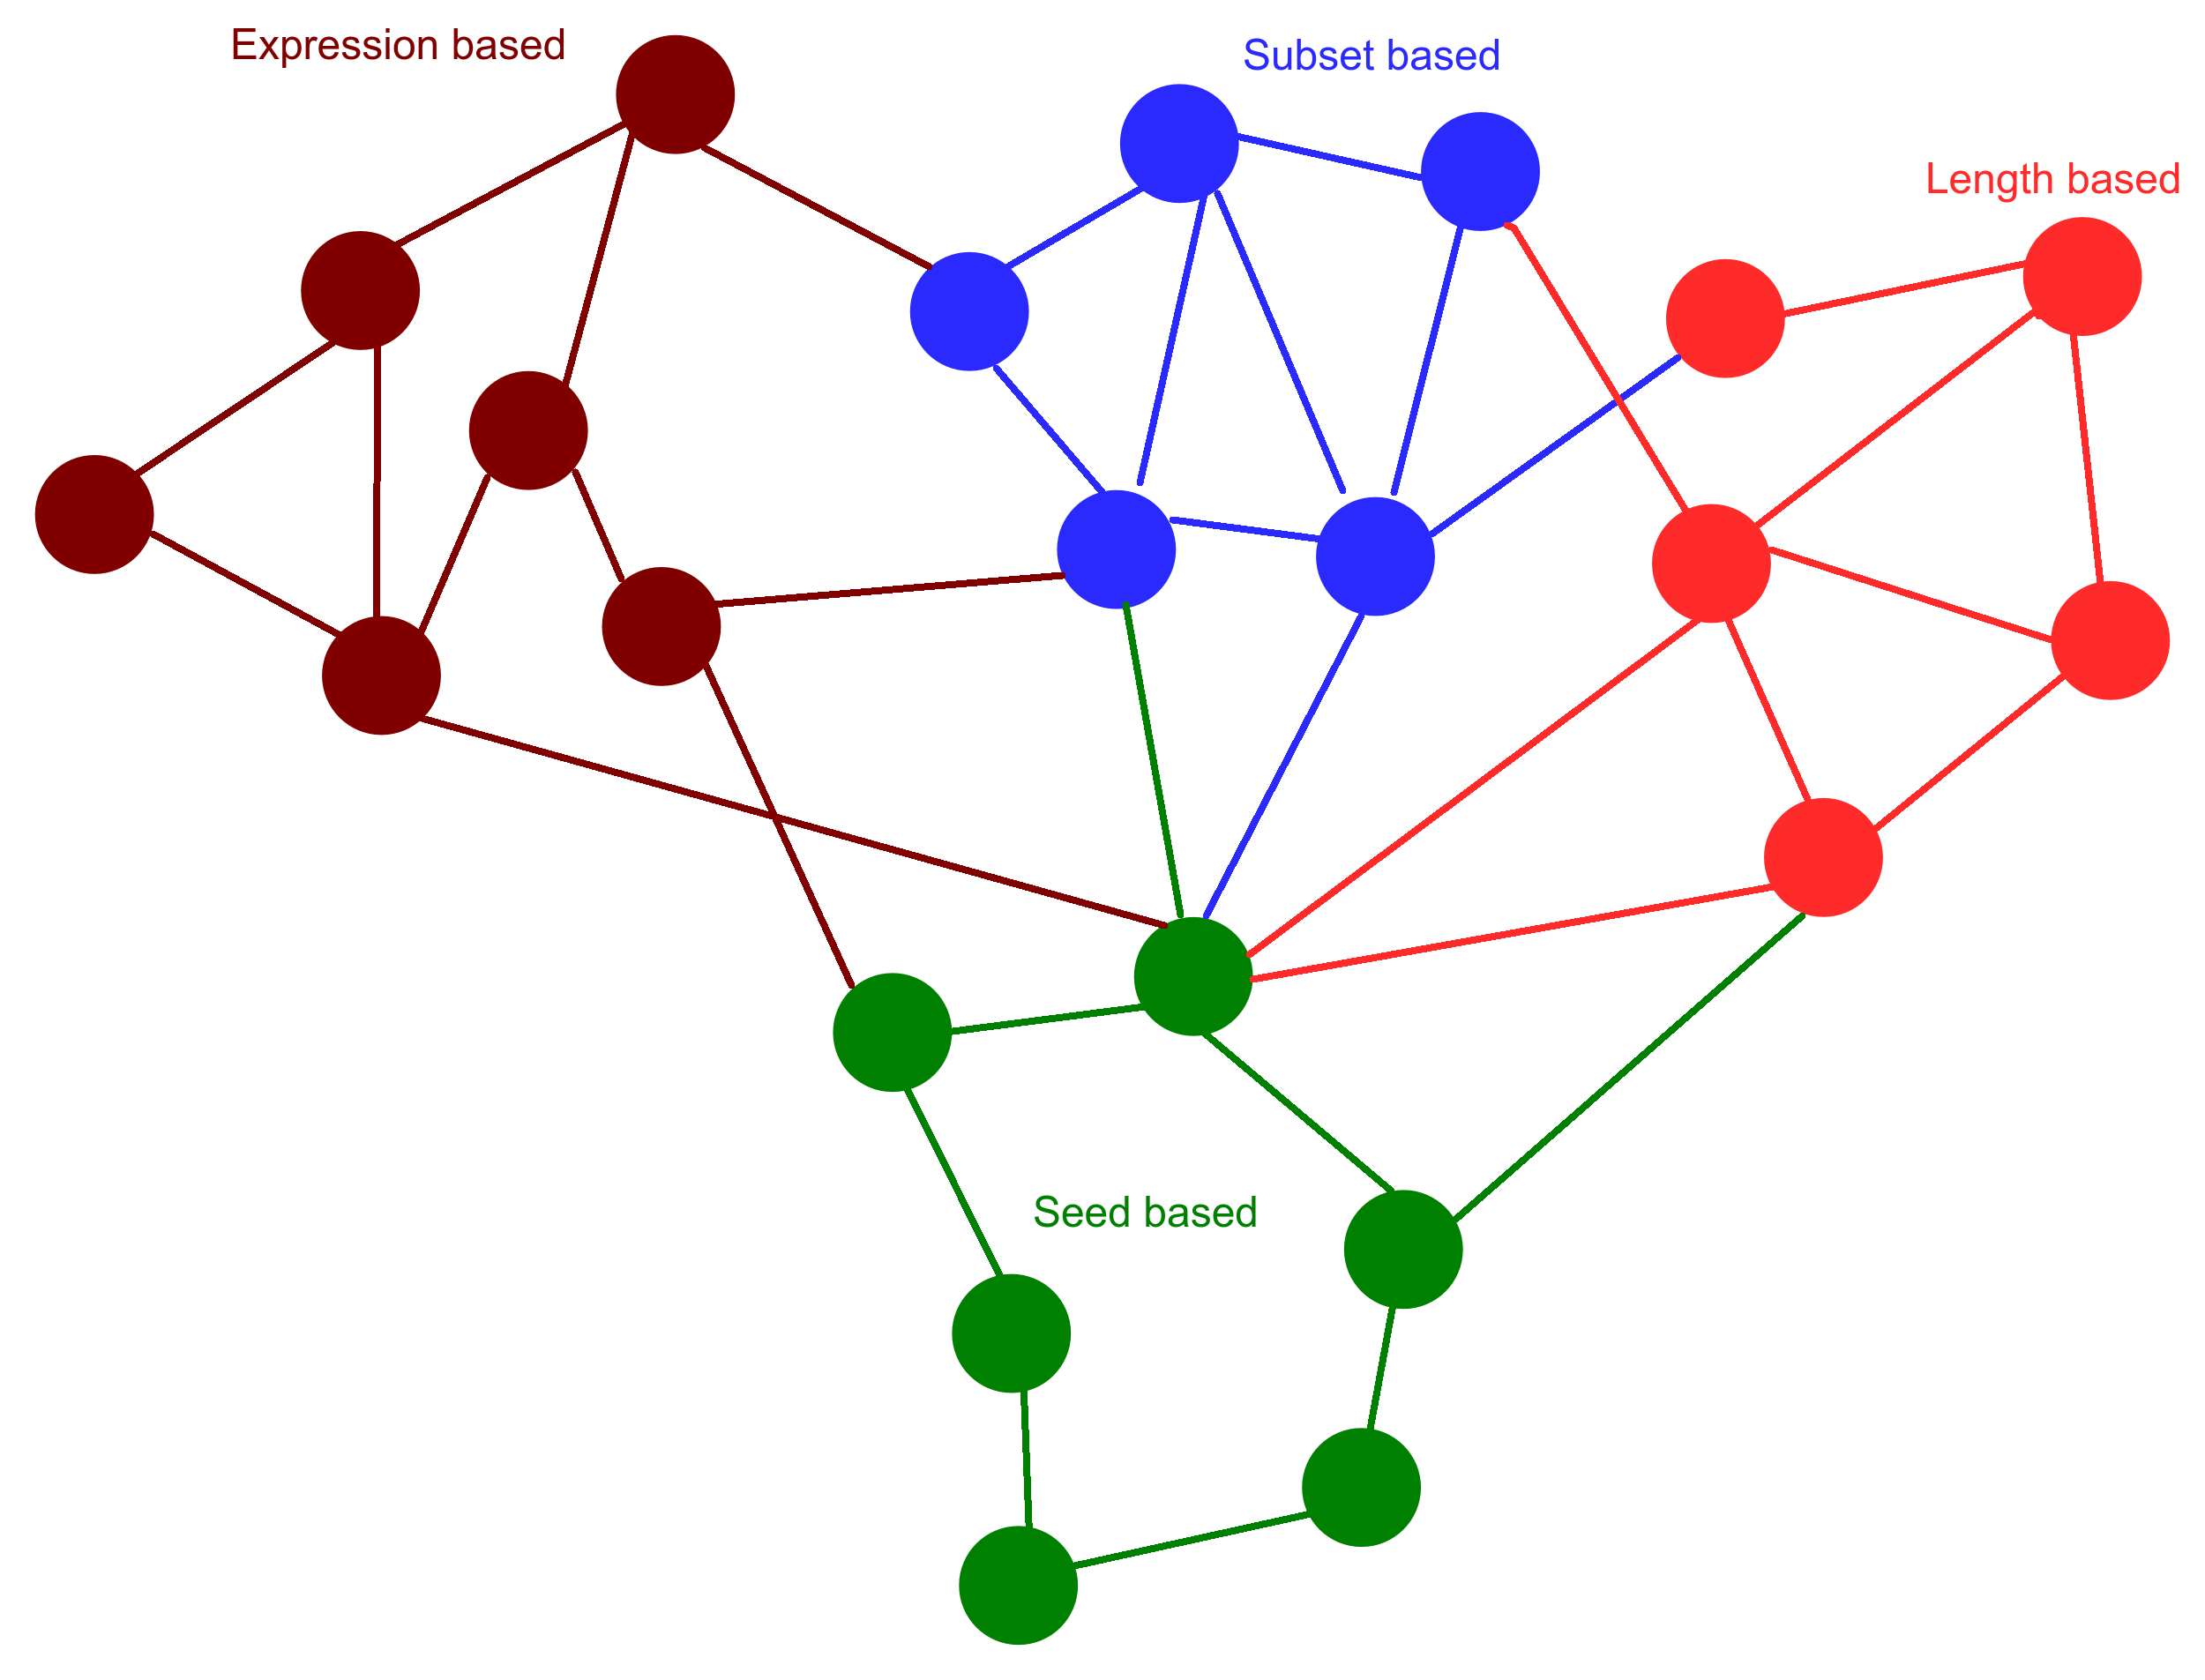
Figure describes the rsRNAs classified in one cluster based on clustering methods namely seed based, length based, expression based and coordinates bound. Commonality across the cluster is studied.
-
Figure describing the analysis performed in database.
-
Complete database structure of the information portal.